The Audit Intelligence add-on enhances Logiqc Auditor with advanced analytics, allowing for deeper tracking of audit trends and specific criteria outcomes.
Use these reports to review audit performance, compare results against benchmarks, and analyse responses to specific audit criteria or questions over time.
Tip: For a detailed step-by-step guide, see the Academy tutorial below.
Audit Intelligence adds advanced reporting to Logiqc Auditor.
- Monitor performance over time: review audit activity across the selected reporting period.
- Identify trends: track changes in audit outcomes and benchmark performance.
- Investigate results in detail: review the outcome of specific audit criteria or questions.
Choose the right report: select the Audit summary report for a high-level view, or the Audit questions report for a more detailed question-level view.
Q: Why can't I see all audit templates in Analytics > Audits?
A: Only audit templates with a benchmark score are available in audit analytics reports.
Q: When should I use the Audit summary report?
A: Use the Audit summary report when you want a high-level view of audit performance across a selected period, including pass and fail trends, benchmark results, and the full audit log.
Q: When should I use the Audit questions report?
A: Use the Audit questions report when you want to review how responses to a specific audit criterion or question change over time, or to investigate whether a failure is isolated or recurring.
Q: Can I open the original audit from a report?
A: Yes. In the Audit questions report, click the Audit ID in the criteria log to drill through to the original audit, where you can review the full context, observations, and any supporting information recorded.
Before you start
Check the following:
- You have Logiqc Auditor.
- You have the required permission to access the analytics reports.
- The audit template you want to report on has a benchmark score.
Step 1: Access audit analytics
Navigate to the audit analytics reports:
Located in the left-hand panel at the bottom.
Click Audits to open the available audit analytics reports.
Then select from the two available report types.
Step 2: Use the audit summary report
Filter by audit template and date range to generate performance graphs.
What this report displays: The Audit summary report provides a high-level view of audit performance, trend movement, and benchmark alignment over the selected period.
- Audit log: A complete, itemised list of every item audited within your selected timeframe.
- Pass/fail trend analysis: A visual timeline tracking the ratio of successful outcomes versus failures, helping you spot shifts in compliance health.
- Benchmarking graph: A monthly breakdown of average audit scores measured against your organisation's predefined performance benchmarks.
Interpreting your data:
| Trend | Potential interpretation |
|---|---|
| Increasing Failures | May signal declining performance, emerging compliance hurdles, or a shift toward more rigorous auditing standards. |
| Decreasing Failures | Indicates successful process improvements, better adherence to standards, and overall performance gains. |
| Stable Numbers | Suggests consistent performance and reliable control environments across the selected periods. |
Explore the reports
Use the arrows to move through the reports, or click an image to zoom in.
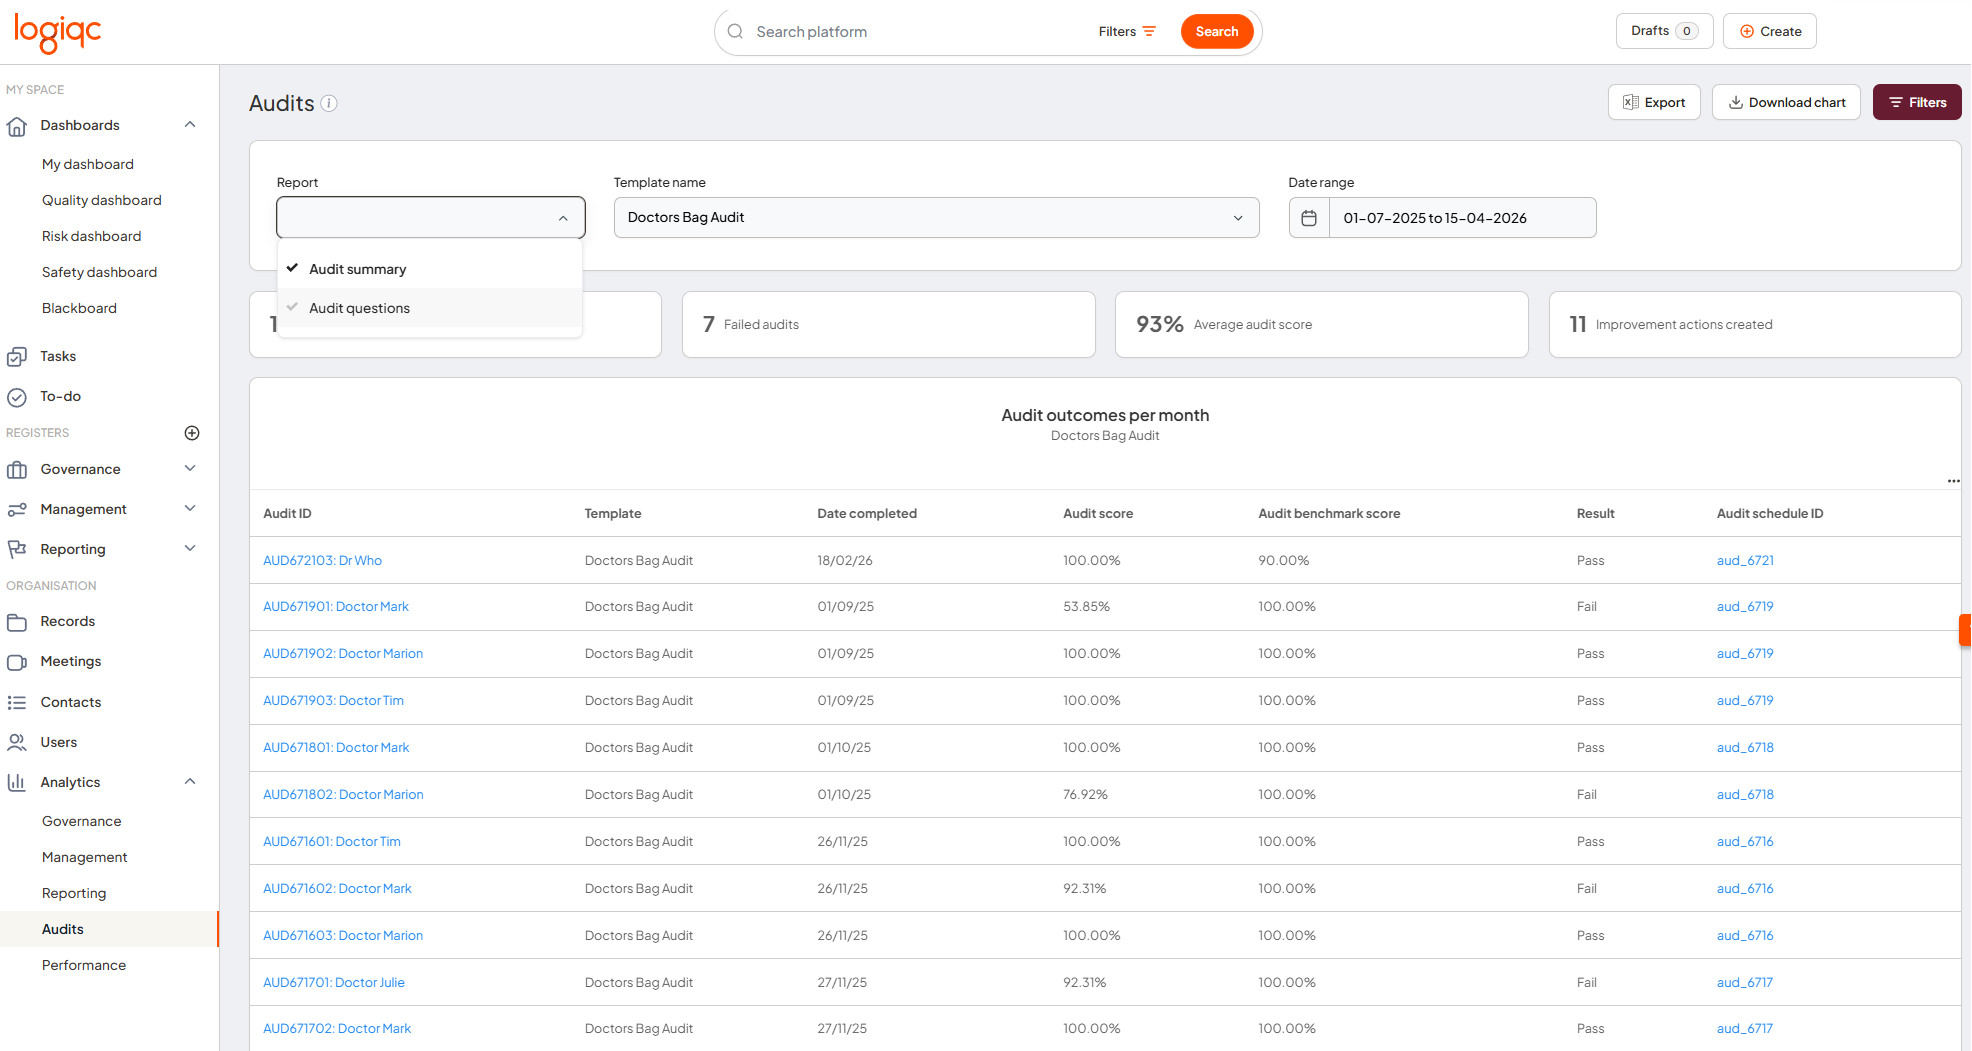
Audit summary dashboard
The Audit summary report provides an overview of audit performance across the selected period.
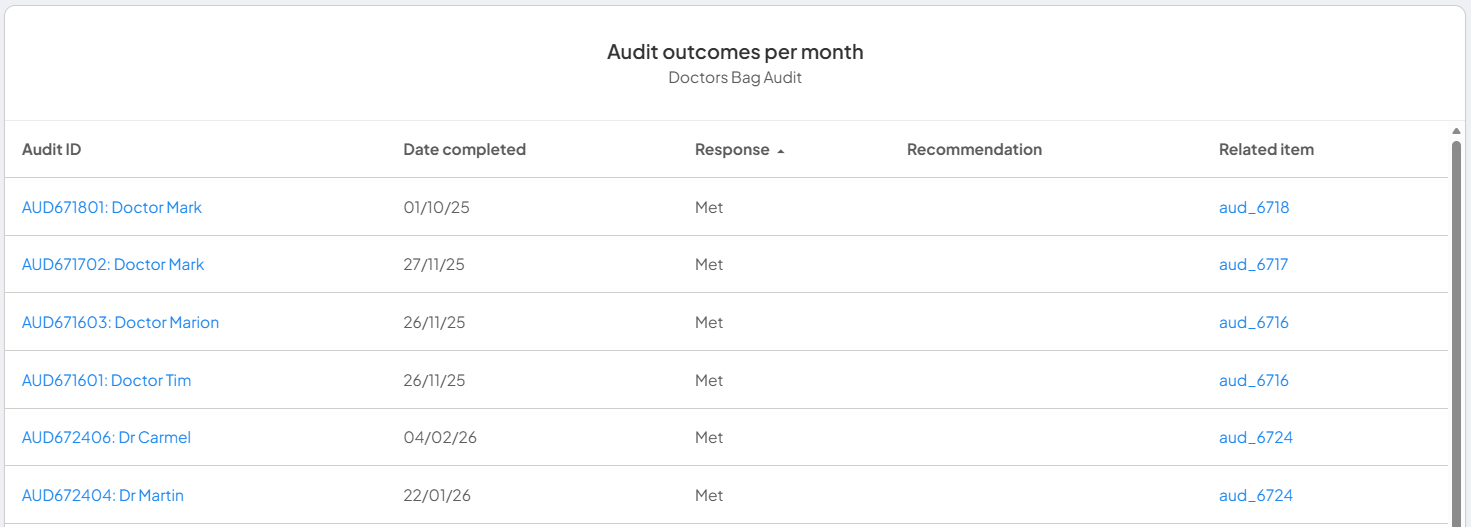
Audit outcomes per month
This table displays a line-by-line breakdown of all audited items over the specified period.
- Review the exact score and outcome for each audit conducted during the period.
- Identify specific outliers or successes that may be hidden in high-level trend graphs.
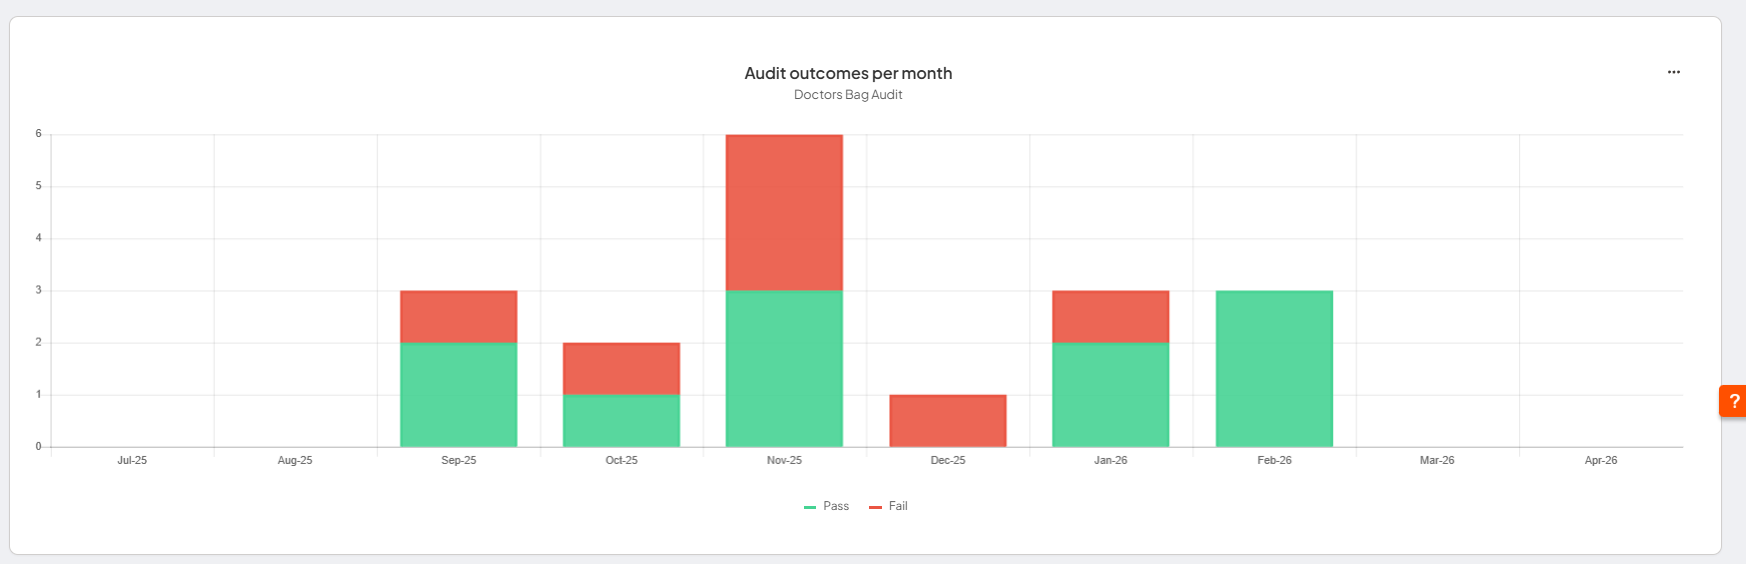
Audit outcomes per month graph
This graph helps you review the ratio of successful audits to failures on a monthly basis.
- Use it as a high-level health check for your operations.
- Spot long-term trends, seasonal fluctuations, or recurring compliance issues that may require targeted intervention.
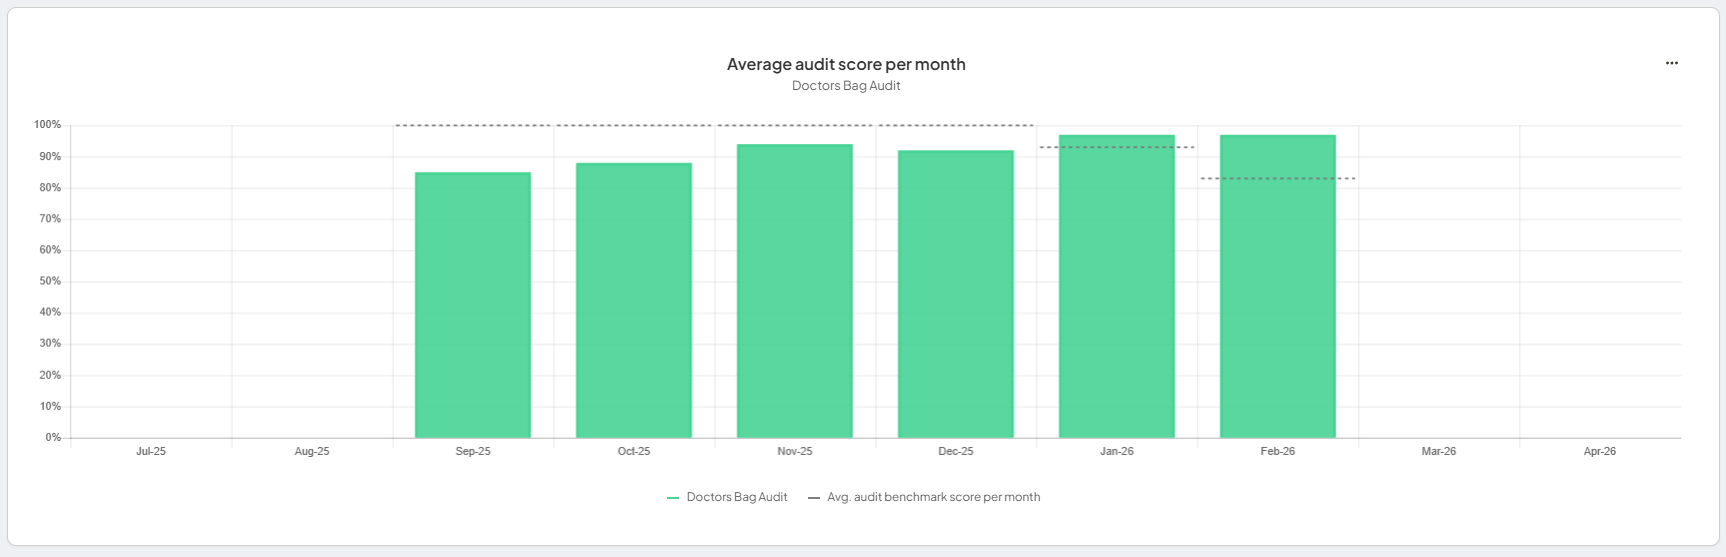
Audit score per month
Use this graph to monitor performance consistency. The graph plots the average score of all audited items alongside your target benchmark, allowing you to quickly identify performance gaps or celebrate sustained excellence.
Step 3: Use the audit questions report
Filter by template, date range, and specific questions to review how responses to individual audit criteria change over time. Use this report to investigate failures and identify whether issues are isolated or recurring.
What this report displays: The Audit questions report shows how responses to a selected audit criterion or question change over time.
- Criteria response trend: Tracks how responses to a selected audit criterion or question change over time. Use this to identify whether a failure is a one-off or a recurring pattern that needs attention.
- Criteria log: Lists responses to the selected criterion within the date range. Click Audit ID to open the original audit, where you can review the full context, any observations recorded, and supporting information. A failed result would normally be expected to include an observation explaining the finding.
Interpreting your data:
| Trend | Potential interpretation |
|---|---|
| Increasing Failures | May signal declining performance, emerging compliance hurdles, or a shift toward more rigorous auditing standards. |
| Decreasing Failures | Indicates successful process improvements, better adherence to standards, and overall performance gains. |
| Stable Numbers | Suggests consistent performance and reliable control environments across the selected periods. |
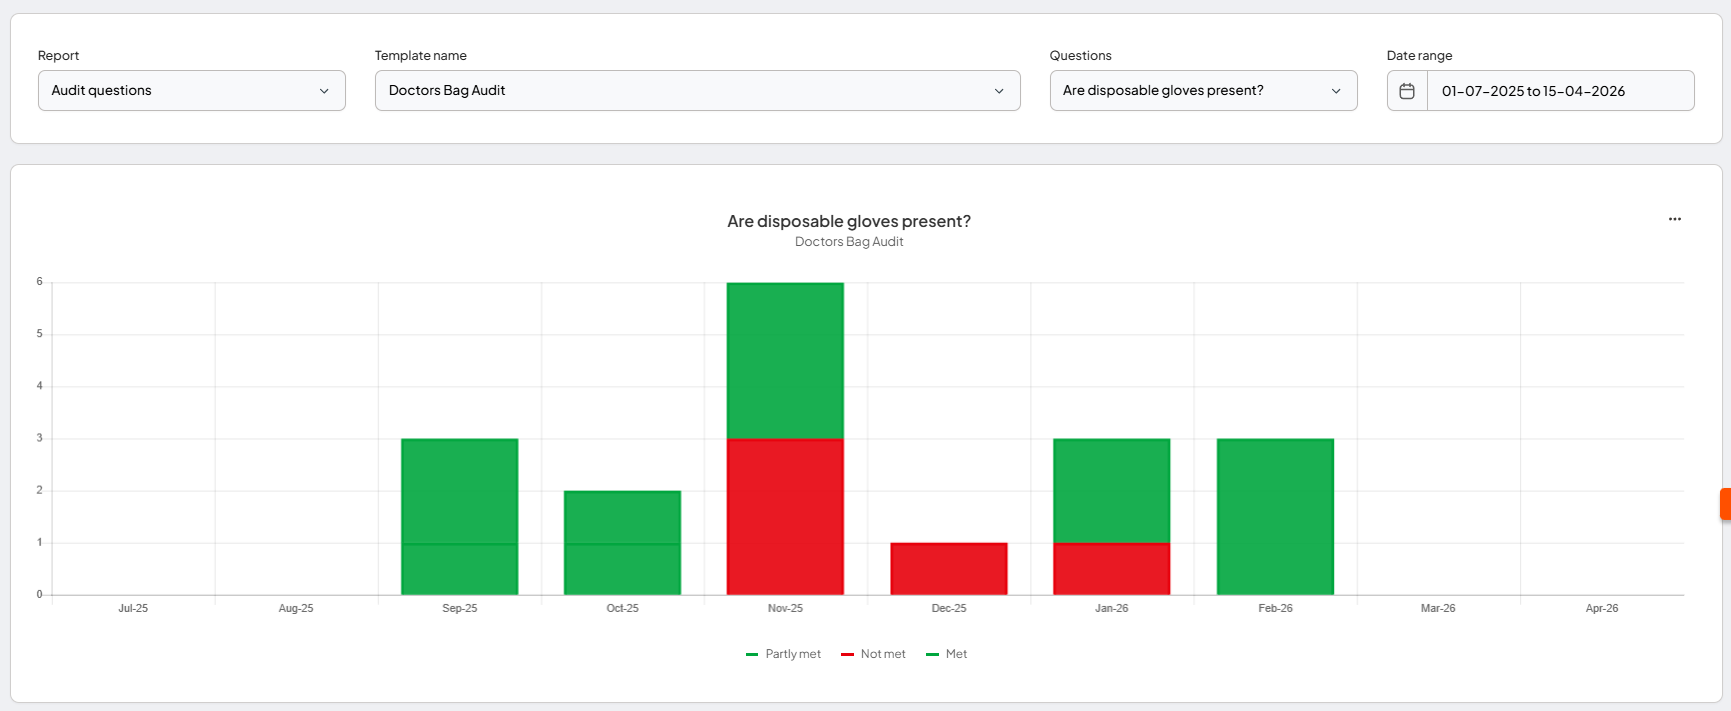
Use this graph to track responses to specific audit criteria or questions over time.
Use this list to investigate specific audits by clicking Audit ID to drill through to the original audit.
What happens next
Monitor audit performance
The reports help you review audit outcomes, compare results against benchmarks, and identify areas that may need attention.
Investigate specific issues
Use the summary and question-level reports together to follow up on recurring issues and support continuous improvement.