Your LogiqcQMS can include up to five dashboards which are accessed under the ‘My space’ section of the left navigation bar:
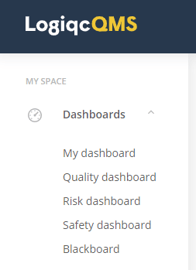
‘My dashboard’ is part of the core system and forms the initial landing page for all users after they log in. The Risk, Quality, and Safety dashboards can be purchased separately.
|
Dashboard |
Description |
Availability |
| My Dashboard (default) | Widgets for the individual user: Task management, frequently viewed documents, and some system-wide activity trends. | Included as part of the core platform |
| Quality |
Widgets for quality and compliance management staff: CQI and CAPA, Audit data, improvement drivers, non-conformance and causal analysis. Included widgets:
|
Purchased separately |
| Risk |
Widgets for senior management and risk managers: exposure alerts, risk analysis, and risk treatment data. Included widgets:
|
Purchased separately |
| Safety |
Widgets for workplace health and safety managers: incident trends, faulty equipment summaries, adverse event by severity (SAC), non-conformance. Included widgets:
|
Purchased separately |
| Blackboard | A blank dashboard to which you can add any widget. Used for preparing presentations on a particular theme. | Included with any purchased dashboard |
To find out more about purchasing these additional dashboards, click here and we'll have a member of our Customer Success Team reach out.